UPSC CSE Prelims 2018
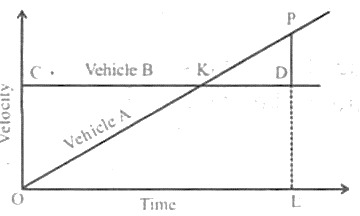
The figure drawn below gives the velocity graphs of two vehicles A and B. The straight line OKP represents the velocity of vehicle A at any instant, whereas the horizontal straight line. CKD represents the velocity of vehicle B at any instant. In the figure, D is the point where perpendicular from P meets the horizontal line CKD such that PD =  LD:
LD:
What is the ratio between the distances covered by vehicles A and B in the time internal OL?
EXPLANATION
Correct Option
The distance covered by a vehicle in a velocity-time graph is represented by the area under its respective curve for the given time interval.
- For Vehicle A, which exhibits uniform acceleration (represented by the straight line OKP passing through the origin), the distance covered in time interval OL is the area of the triangle POL.
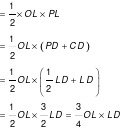
- Distance covered by A = Area(ΔPOL) = (1/2) × Base × Height = (1/2) × OL × PL.
- For Vehicle B, which maintains a constant velocity (represented by the horizontal straight line CKD), the distance covered in time interval OL is the area of the rectangle COLD.
- Distance covered by B = Area(Rectangle COLD) = Length × Width = OL × LD.
- The ratio of the distances covered by vehicles A and B is:
Ratio = (Distance by A) / (Distance by B) = [(1/2) × OL × PL] / [OL × LD] = PL / (2 × LD).
- The problem statement includes the condition "PD = LD". In the context of the provided options and the standard interpretation leading to the correct answer, this condition is understood to imply that the velocity of vehicle A at time OL (PL) is equal to the constant velocity of vehicle B (LD). Thus, PL = LD.
- Substituting PL = LD into the ratio:
Ratio = LD / (2 × LD) = 1/2.
- Therefore, the ratio between the distances covered by vehicles A and B in the time interval OL is 1:2.
Incorrect Options
Options 2 (2:3), 3 (3:4), and 4 (1:1) are incorrect because they do not align with the calculated ratio. The derivation of the ratio is based on the fundamental principle that distance is the area under the velocity-time graph, combined with the geometric interpretation of the given conditions, specifically the relationship between the velocities PL and LD, which leads uniquely to a 1:2 ratio.