UPSC CSE Prelims 2011
Read the passage given below, study the graph that follows and answer the question.
During a party, a person was exposed to contaminated water. A few days later, he developed fever and loose motions. He suffered for some days before going to a doctor for treatment. On starting the treatment, he soon became better and recovered completely a few days later. The following graph shows different phases of the person's disease condition as regions A, B, C, D and E of the curve.
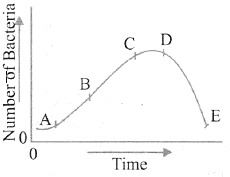
Which region of the curve indicates that the person began showing the symptoms of infection?
EXPLANATION
Correct Option (B)
Region B indicates the onset of symptoms. The passage describes the person developing fever and loose motions "a few days later" after exposure to contaminated water. This period immediately following the incubation phase (Region A, where the pathogen multiplies without overt symptoms) marks the emergence of clinical manifestations of the disease. Therefore, B represents the initial symptomatic phase.
Incorrect Options:
- Option A: This region typically represents the incubation period, which is the interval between exposure to an infectious agent and the appearance of the first symptoms. During this phase, the pathogen is replicating, but the host remains asymptomatic.
- Option C: This region would likely correspond to the peak or acute phase of the illness, where symptoms are most severe and the person is actively suffering, as described in the passage ("He suffered for some days"). Symptoms would have already been present and progressed beyond their initial onset.
- Option D: This region usually signifies the recovery or convalescence phase. Following treatment, the person "soon became better and recovered completely," indicating a decline in symptoms and a return to health. Symptoms are subsiding or have disappeared during this stage.